Led by the University of Chicago research coalition, the US COVID Atlas is a COVID-19 pandemic visualization tool that can assist to locate regional hot spots, track patterns, explore transmission at state and county levels, identify community health factors and socioeconomic indicators and identify emerging risk.
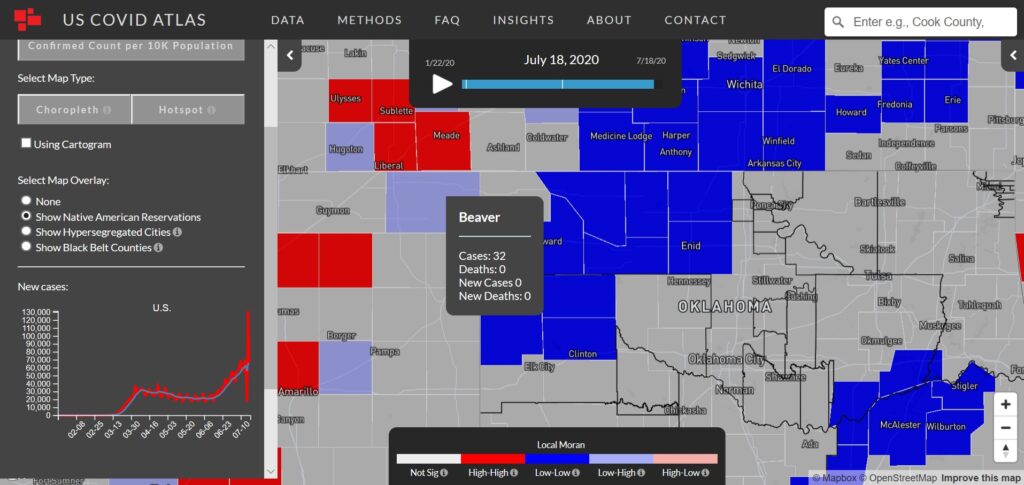
Here’s one example of how you can use this powerful data tool to improve the risk communication and mitigation efforts in your community? By looking at population adjusted cases at the county level in Oklahoma, this map identifies (in near real-time) statistically significant outliers and/or clusters, such as Beaver County. Beaver County is currently an area with a low case rate but is surrounded by counties with high case values.